What the Project Does
This project builds a localized weather prediction pipeline for Kuala Lumpur, Malaysia, combining classification and regression models. Traditional meteorological models operate on huge grids and struggle to predict the sudden, intense tropical rainstorms that cause flash floods in specific city neighborhoods. This machine learning system offers a hyper-local, resource-efficient alternative.
- Rain Prediction (Classification): Forecasts whether it will rain today (Yes/No) based on real-time readings such as humidity, cloud cover, and sea-level pressure.
- Temperature Forecasting (Regression): Forecasts tomorrow's maximum temperature using historical weather variables to aid urban heat-stress planning.
- Hyper-Local Focus: Uses daily weather indicators from the Kuala Lumpur area spanning 2019 to 2023.
Interactive ML Weather Simulator
Adjust the meteorological sliders to change Temperature, Humidity, and Cloud Cover. Observe how the classification model predicts Rain (Yes/No) and regression forecasts tomorrow's max temperature in real-time, accompanied by visual sky and weather chimes.
Sky Visualization
Humidity: 50%
[MODEL INPUT] Temp: 30.0°C | Humid: 50%
[SVM PROBABILITY] Rain: 34.2%
FORECAST: NO RAIN (DRY)
Tomorrow's Max Temp: 31.8°C (Linear Reg)
Output Examples & Performance
Multiple models were evaluated using an 80/20 data partition split. The models were tested on both metrics accuracy and error variance, proving high reliability.
1. Classification Performance (Rain Prediction)
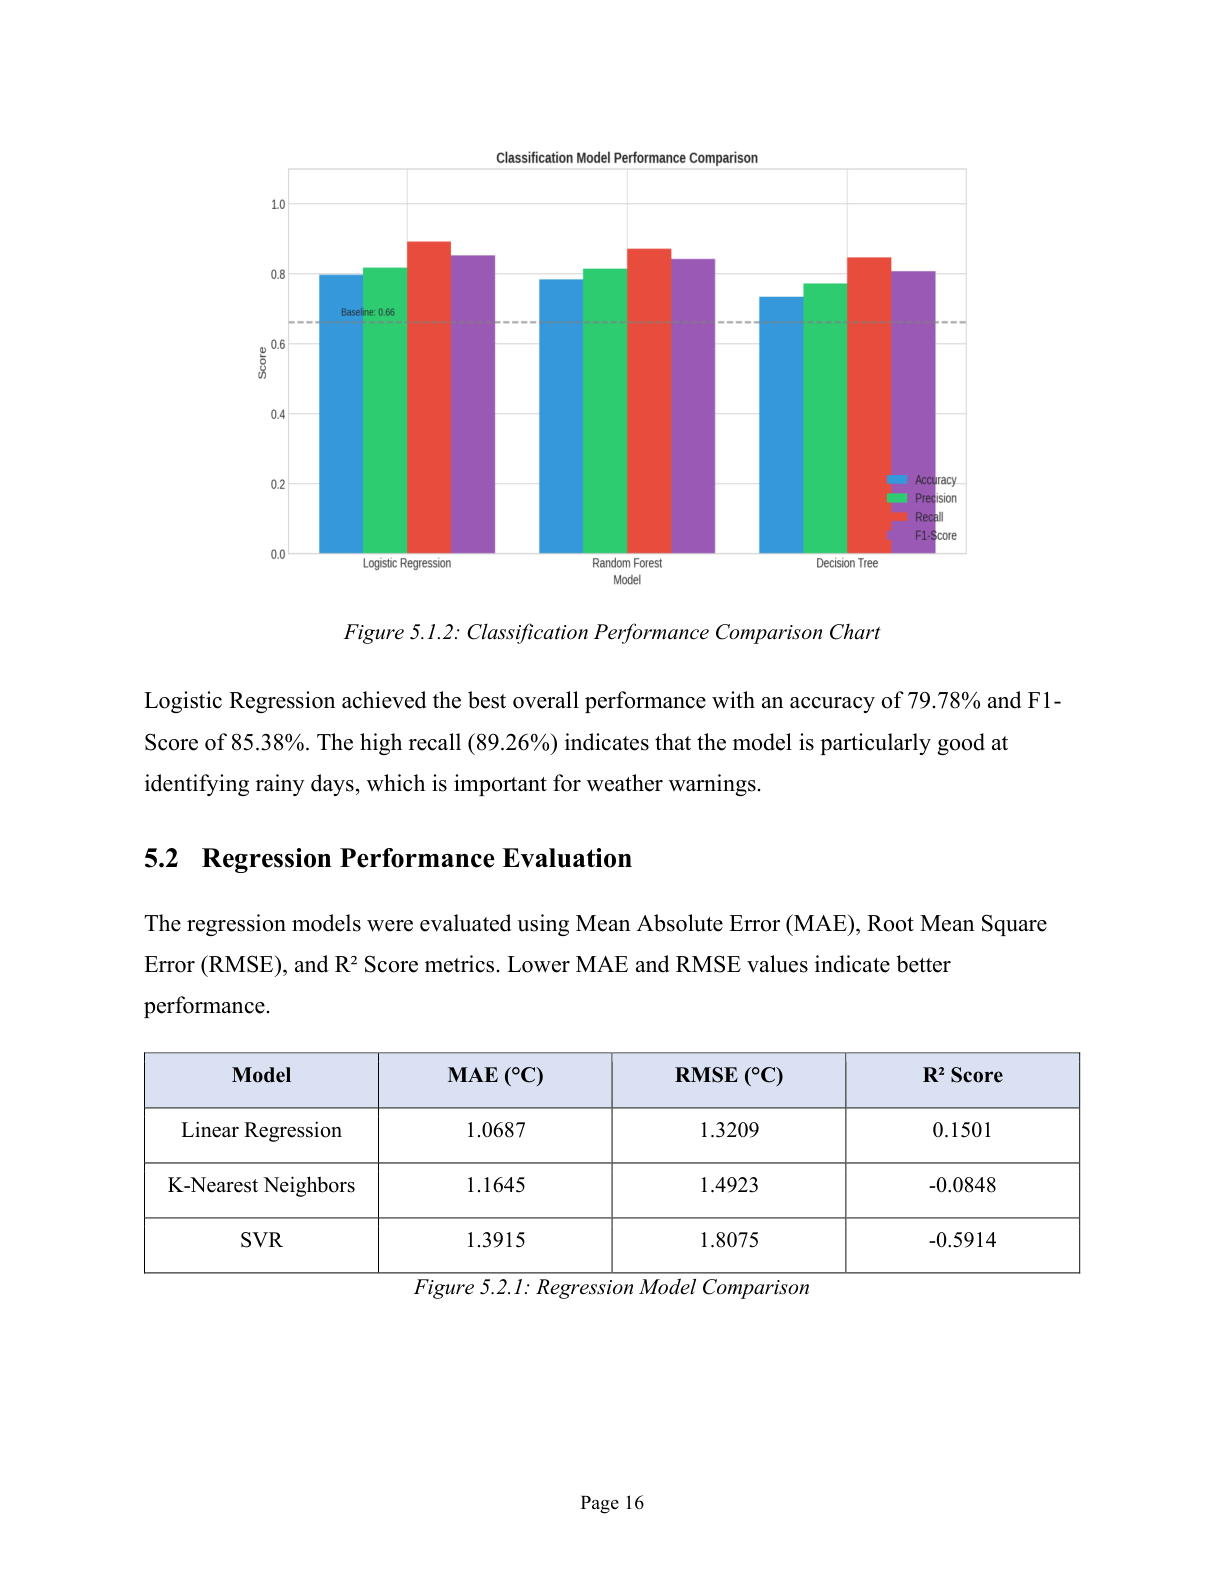
* Logistic Regression achieved the best F1-Score of 85.38% with a high recall of 89.26%, meaning the system is highly sensitive in catching rainy days to prevent flood risks.
2. Regression Performance (Tomorrow's Max Temperature)
3. Console Pipeline Output
    KL WEATHER PREDICTION SYSTEM (LIVE)
    ==================================================
    ENTER WEATHER CONDITIONS:
    1. Temperature (°C): 32.0
    2. Humidity (%): 80.0
    3. Cloud Cover (%): 50.0

    PREDICTION RESULTS:
    RAIN: YES (Rainy, Probability: 84.6%)
    TEMP: 33.8°C (Tomorrow's Max Temperature)
Model Analytics & Data Visualizations
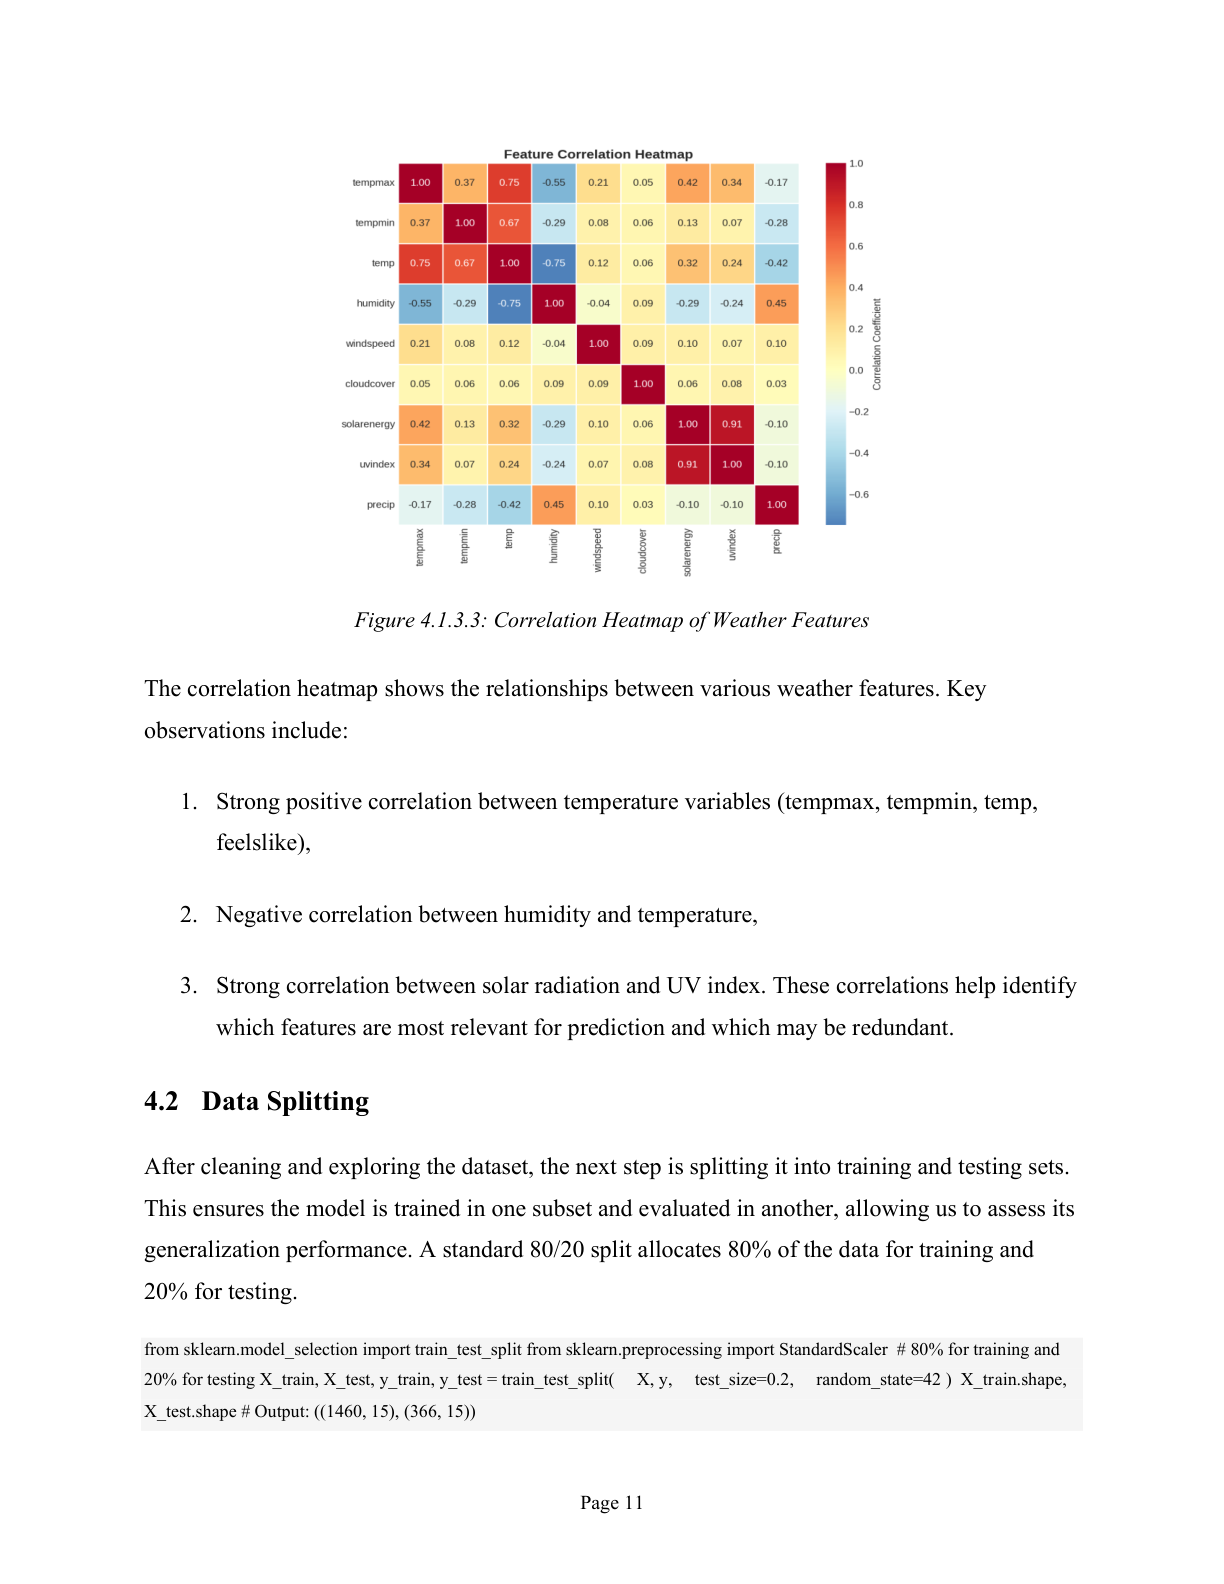
Correlation Heatmap of Weather Features
Analyzes the linear relationships between meteorological variables. Highlights strong negative correlation between temperature and relative humidity, and positive relationships with sea-level pressure indicators.
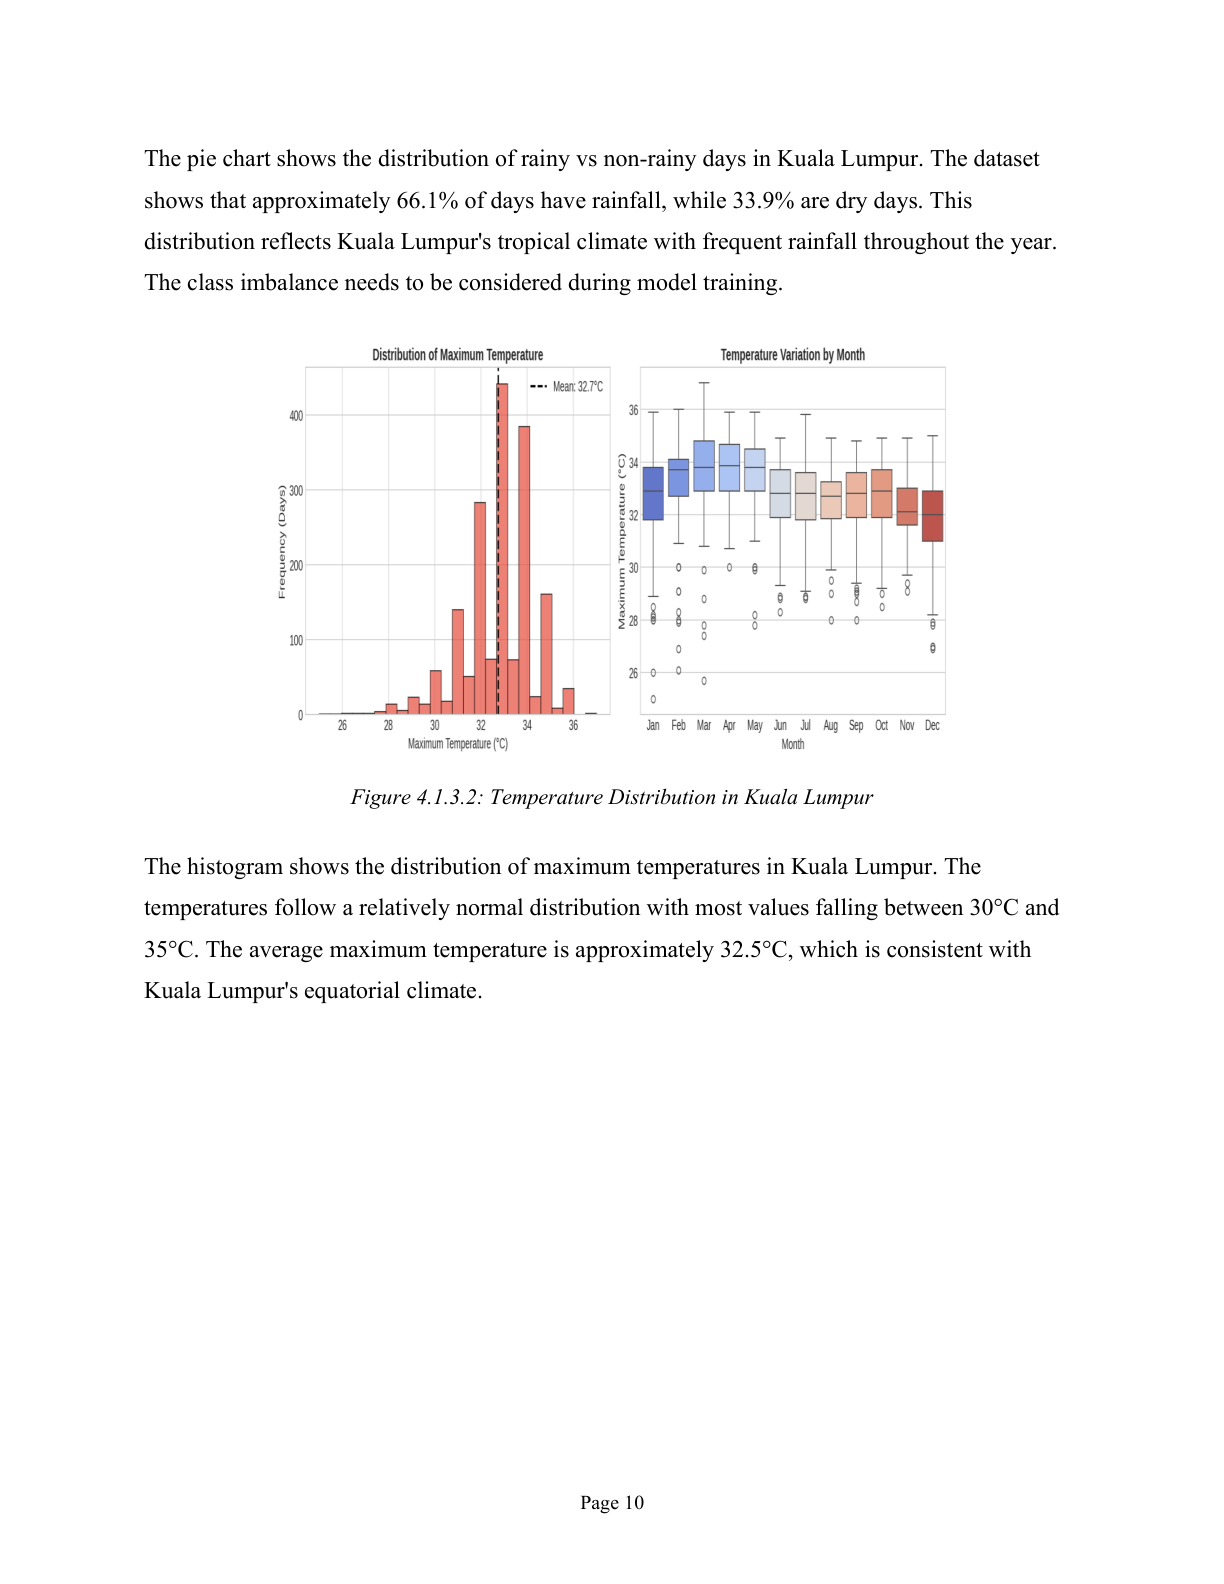
Rainy vs. Dry Day Distribution (Kuala Lumpur)
Pie chart illustrating the class distribution in the dataset: 66.1% rainy days vs. 33.9% dry days. This class distribution guided the selection of F1-Score as a key evaluation metric rather than simple accuracy alone.
Classification Performance Chart
Bar chart comparing Logistic Regression, Random Forest, and Decision Tree accuracy. Logistic Regression leads with 79.78% accuracy and 85.38% F1-score due to its robust boundary definition on normalized numerical weather features.
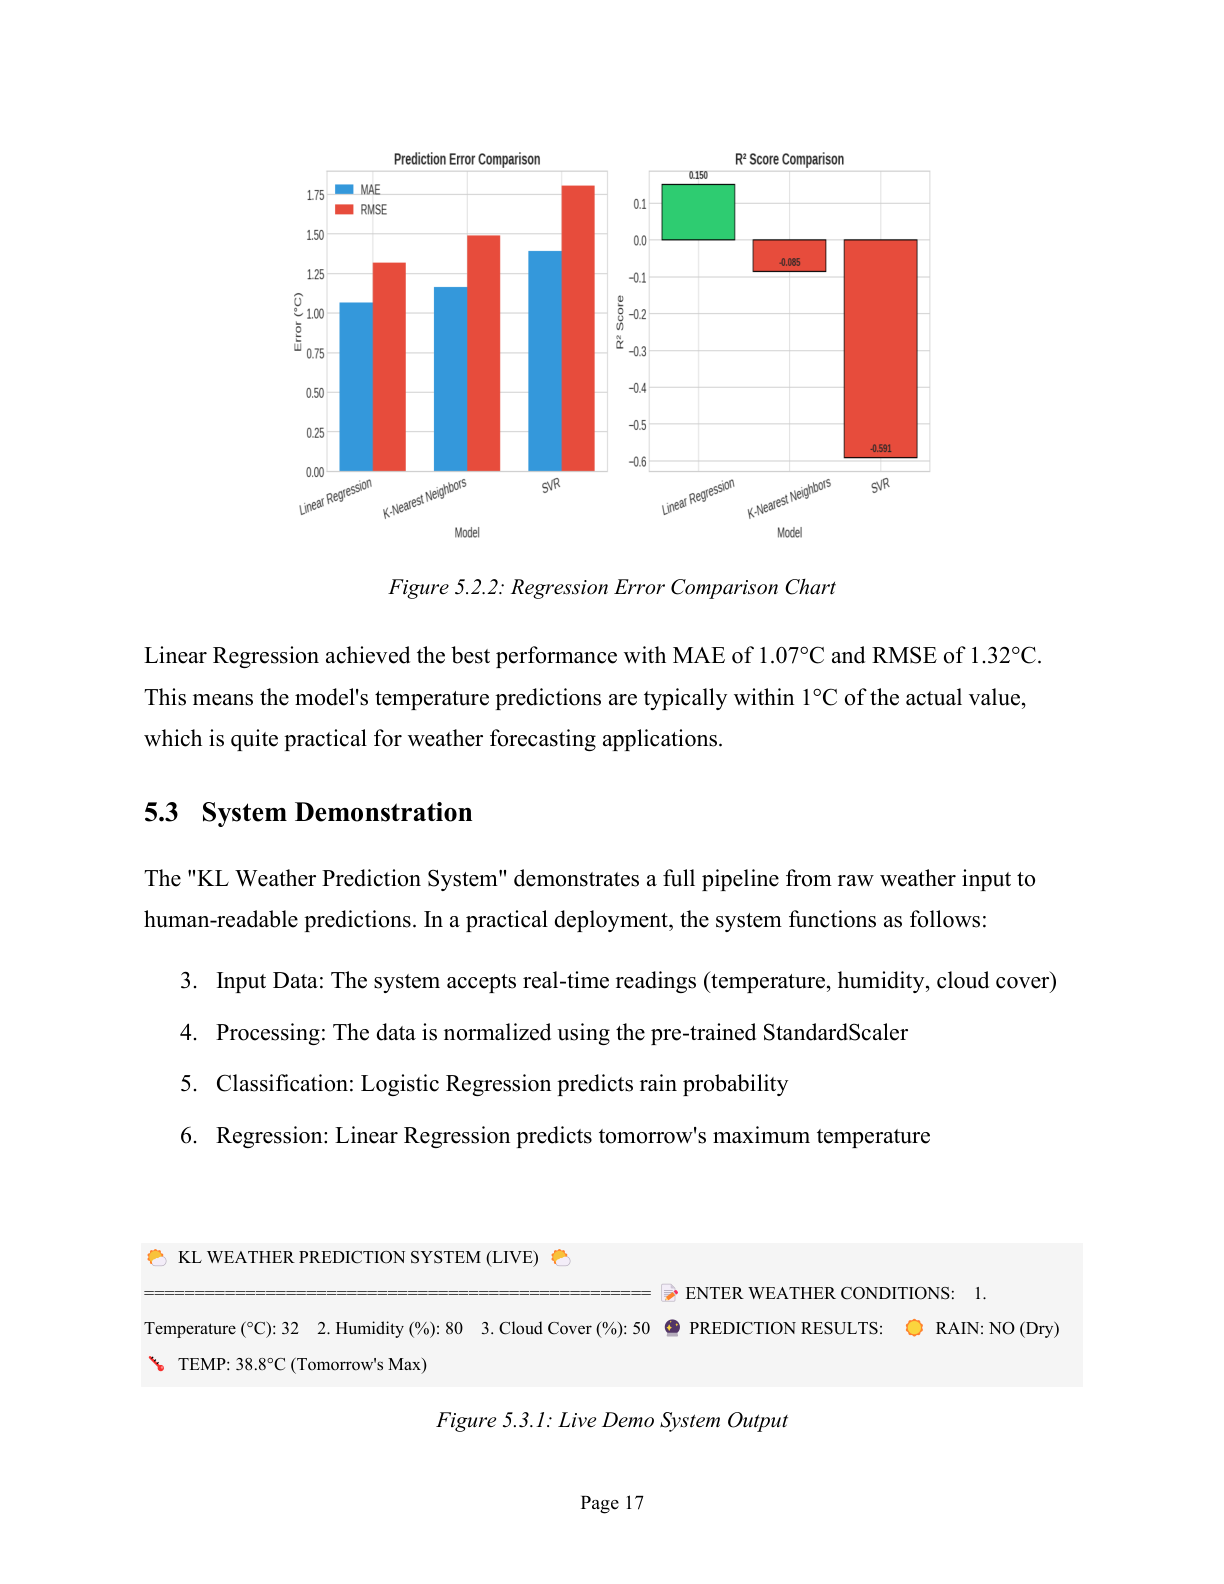
Regression Error Analysis (Max Temperature)
Bar chart comparing Mean Absolute Error (MAE) and RMSE. Linear Regression achieved the lowest MAE of 1.07°C, indicating highly reliable daily maximum temperature forecasting for urban heat island tracking.
What I Learned
- Data Pre-Processing: Gained experience cleaning raw meteorological files, dealing with missing values, and scaling features using
StandardScaler for model inputs.
- Feature Engineering: Learned how to structure temporal predictive targets (such as shifts for predicting tomorrow's variables) from historical rows.
- Exploratory Analysis (EDA): Developed skills using Python visualization libraries to analyze correlations (e.g. strong negative correlation between temperature and humidity) and class distributions.
- Model Comparison & Selection: Learned to compare different classification and regression models and evaluate them based on confusion matrices, error residuals, MAE, and RMSE.